IEOR 115 Database Design Project
Group 6 - Spring 2013
Group 6 Members
- Steven Belding
- Ami Bigit
- Morgan Fabian
- Kimberly Lam
- Ben Lewis
- Mana Nabati
- Khoa Tran
- Alicia Zacherle
About Our Client
- San Francisco-based startup
- 9 employees
- 1 warehouse
- 1 store (almost)
- PC platform
- Currently use MS Excel
- Representative, and owner: Rachel Malsin
Their Product: Juice
About the juice |
Three types of cleanses |
| 15 different juices | 1. “Can You Kick It” for beginners |
| Raw + Organic | 2. “Stuck in the Middle” for intermediate customers |
| Cold pressed | 3. “Forever Young” for advanced customers |
Juice cleanse options
|
Their Current Database
- Currently they use Microsoft Excel
-
The primary sheets: Order sheet, Customer sheet, Production sheet,
Packaging, Delivery, and Labeling sheet -
Order directly through their website
-
Linked to Shopify, a web-based e-commerce platform
that allows businesses to create online stores - Orders are then manually entered into Excel.
-
Linked to Shopify, a web-based e-commerce platform
- Currently, there are about 200 records in their spreadsheets
What We Can Do
-
User friendly database that’s easy to understand by their employees
- Error Avoidance
- Construct powerful queries to sort and filter data
- Generate reports and forms to navigate data easily
- Inventory control
-
Increasing production efficiency
- Reducing cycle time
- Reduce amount of waste produced
- Scheduling order of processes
- Preventative maintenance
-
Analysis of their company strengths and weaknesses
- Effectiveness of marketing techniques and event promotions
Team's Responsibilities
- Communication with “Project: Juice”: Steven Belding, Mana Nabati
- Internal/External Scheduling: Steven Belding
- Access database design: Ami Bigit, Ben Lewis, Khoa Tran
- Generating ‘Cardinality Constraints’ diagrams: Ami Bigit, Kimberly Lam
- Writing reports: Morgan Fabian, Mana Nabati, Alicia Zacherle
- Preparing PowerPoint presentations: Morgan Fabian
- Presenters: All members (3 members for each presentation)
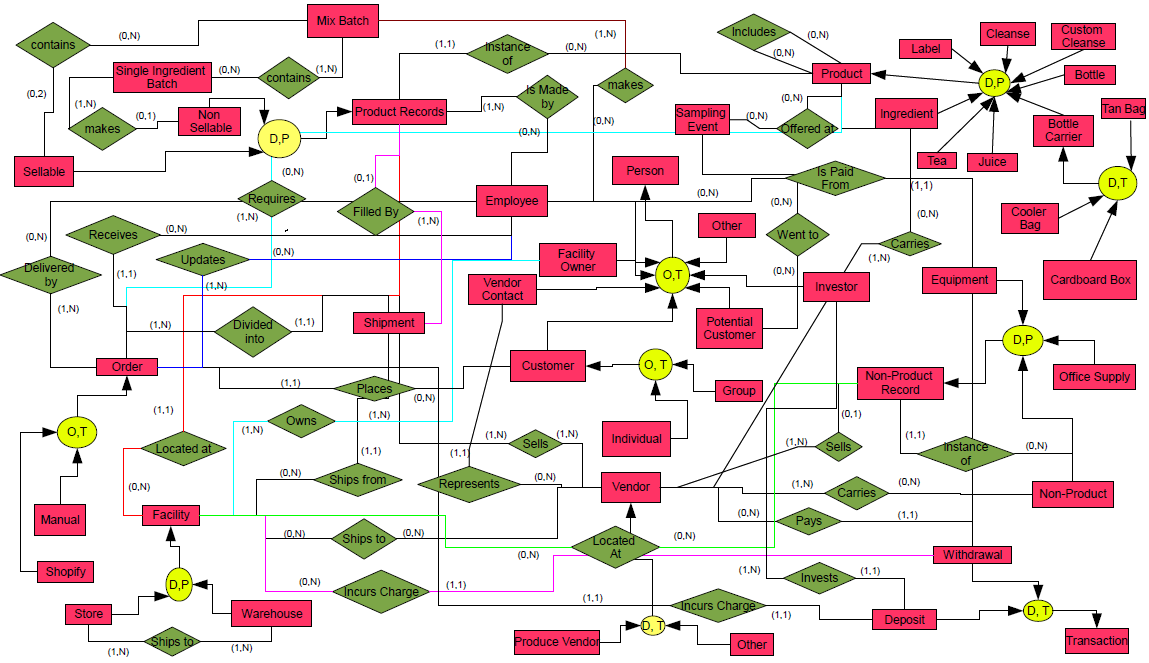
EER Diagram
Schema
- Person(PersonID, Lname, Fname, MI, Street, Street2, City, State, Zip, Telephone, Email)
- Customer(CID1, Customer_Type, Group_Name, Bdate, Gender, Company)
- Employee(EID1, SSN, Bdate, Job_Title, Salary, Hourly_Wage)
- Facility_Owner(FOID1, Company_Name)
- Potential_Customer(ContactID1, Place_of_Contact, Date_Of_Contact, Company_Name, SamplingEvent20)
- Vendor_Contact(ContactID1, Job_Title, Company_Name)
- Investor(InvID1, Company_Name)
- Other_Person(ContactID1, Description)
- Order(OID, Date_Placed, Time_Placed, CID2, Input_Type, TID31, Recieved_By3, Shipping_Address1, Shipping_Address2)
- Facility(FacilityID, Name, Address1,Address2, City, State, Zip, Telephone, Facility_Type)
Schema (cont.)
- Vendor(VID, Company_Name, Type, ContactID6, Address1, Address2, City, Zip, Telephone, Email)
- Product(PID, Pname)
- Ingredient(PID12, Season)
- Juice(PID12, Shelf_Life)
- Tea(PID12, Shelf_Life)
- Bottle(PID12, Size, Material, Cost, VendorID11)
- Label(PID12, Size, Printed_At, For_Bottle_Size, Cost, VendorID11)
- Bottle_Carriers(PID12, Carrier_Type, Color, Cost, Insulated)
- Cleanse(PID12, Cleanse_Name, Number_of_Days, Price)
- Sampling_Event(EventID, Date, Place, Event_Name, Type, Event_Description)
Schema (cont.)
- Non-Product(NID, Name, Type, Description, Restock_Every)
- Equipment(EquipID26, EName, Type)
- Office_Supplies(SupplyID26, OName, Type)
- Non-Product_Record(NID26, Date_Purchased, Instance, Location10, VID11, Cost)
- Transaction(TID, Amount, TDate, TTime)
- Withdrawl(TID30, Type, SBottle(PID12, Size, Material, Cost, VendorID11)
- Label(PID12, Size, Printed_At, For_Bottle_Size, Cost, VendorID11)
- Bottle_Carriers(PID12, Carrier_Type, Color, Cost, Insulated)
- Cleanse(PID12, Cleanse_Name, Number_of_Days, Price)
- Sampling_Event(EventID, Date, Place, Event_Name, Type, Event_Description)
Schema (cont.)
- SalaryEmployeeID3, Facility_Rent4, Refund_Order9, Vendor_Purchase11, Amount)
- Deposit(TID30, OID9, InvestorID7, Type, Amount)
- Updates_Order(OID9, EID3, UDate, UTime)
- Employee_Makes_SIBatch_With_Equip(EID3, SIBID23, EquipID27, Time_Started, Time_Ended)
- Employee_Makes_MixedBatch_With_Equip(EID3, MixedBID24, EquipID27, Time_Started, Time_Ended)
- Employee_Makes_Sellable_Product(EID3, PID21, PDate21, Pinstance21)
- Order_Details(OID9, PID12, Quantity)
- Vendor_Contact_List (VID11, Vendor_Contact6)
- Product_Facility_To_Facility_Sellable(PID21, PDate21, Pinstance21, Original_Facility10, New_Facility10, TransportDate)
- Product_Facility_To_Facility_Nonsellable(PID22, PDate22, Pinstance22, Original_Facility10, New_Facility10, TransportDate)
Schema (cont.)
- NonProduct_Facility_To_Facility(NID29, NPDate29, NPInstance29, Original_Facility10, New_Facility10, TransportDate)
- Vendor_Ships_To_Facility(VID11, Ships_To10, SDate, STime)
- Vendor_Carries_Product(VID11, Product_ID12, Season)
- Vendor_Carries_NonProduct(VID11, NonProduct_ID26)
- Prod_Includes_Prod(Product12, Sub_Product12, Liquid_Volume)
- MBatch_Contains_SIBatch(Mixed_BID24, SI_BID23, Liquid_Volume)
- NonSellable_Makes_Batch(Nonsellable_PID22, NBDate22, NBInstance22, SI_BID23)
- Facility_Owned_By(Facility_ID10, Facility_Owner4)
- Ship_Is_Filled_By(SID25, PID21, Date21, Instance21)
- Cleanse_Details(PID19, OID9, Quantity, Juice114, Juice214, Juice314, Juice414, Juice514, Juice614, Tea115)
- Juices_At_Event(PID12, EventID20)
MS Access Screenshot

Query1 - Batch Contamination Analysis
Purpose
Recall from contaminated order – shows which customers to contact in the case of a potential contamination. This query identifies all customers who received juices that were made from the same single ingredient and mixed batches as the contaminated order. Batches are the intermediate steps in juice production between the raw produce and the final product.Query1 - Batch Contamination Analysis
SQL Implementation
select c.[Number of Possible Contaminated], *
from person AS p, [Query_4_#_Contam] AS c
where p.PersonID in (

 select o.cid
 from [order] o
 where o.oid in (

  select s.oid
  from shipment s
  where s.sid in (

   select z.sid
   from ship_Is_filled_By z
   inner join (

    select R.Instance, R.PID, R.pDate
    from Product_Record_Sellable R
    where R.Mixed_BID1 in (

     select B.mixed_BID
     from mbatch_contains_sibatch B
     where B.SI_BID in (
Query1 - Batch Contamination Analysis
      select distinct BB.SI_BID
      from mbatch_contains_sibatch bb
      where BB.Mixed_BID in (

       select distinct RR.mixed_BID1
       from Product_Record_Sellable RR
       where RR.PID in (
        select zz.PID from ship_is_filled_by zz where zz.SID in (
        select ss.sid from shipment ss where ss.oid in (
        select oo.oid from [order] oo where oo.cid = 115753140 AND oo.Date_Placed = #1/2/2013#))
       )
       AND RR.pDate in (
        select zz.pDate from ship_is_filled_by zz where zz.SID in (
        select ss.sid from shipment ss where ss.oid in (
        select oo.oid from [order] oo where oo.cid = 115753140 AND oo.Date_Placed = #1/2/2013#))
       )
       AND RR.Instance in (
        select zz.Instance from ship_is_filled_by zz where zz.SID in (
        select ss.sid from shipment ss where ss.oid in (
        select oo.oid from [order] oo where oo.cid = 115753140 AND oo.Date_Placed = #1/2/2013#))
       )
     )
Query1 - Batch Contamination Analysis
     OR BB.Mixed_BID in (
      select distinct RR.mixed_BID2
      from Product_Record_Sellable RR
      where RR.PID in (
       select zz.PID from ship_is_filled_by zz where zz.SID in (
       select ss.sid from shipment ss where ss.oid in (
       select oo.oid from [order] oo where oo.cid = 115753140 AND oo.Date_Placed = #1/2/2013#))
      )
      AND RR.pDate in (
       select zz.pDate from ship_is_filled_by zz where zz.SID in (
       select ss.sid from shipment ss where ss.oid in (
       select oo.oid from [order] oo where oo.cid = 115753140 AND oo.Date_Placed = #1/2/2013#))
      )
      AND RR.Instance in (
       select zz.Instance from ship_is_filled_by zz where zz.SID in (
       select ss.sid from shipment ss where ss.oid in (
       select oo.oid from [order] oo where oo.cid = 115753140 AND oo.Date_Placed = #1/2/2013#))
      )
    )
  )
 )
Query1 - Batch Contamination Analysis
  OR R.Mixed_BID2 in (
  select B.mixed_BID
  from mbatch_contains_sibatch B
  where B.SI_BID in (
   select distinct BB.SI_BID
   from mbatch_contains_sibatch bb
   where BB.Mixed_BID in (
     select distinct RR.mixed_BID1
     from Product_Record_Sellable RR
     where RR.PID in (
       select zz.PID from ship_is_filled_by zz where zz.SID in (
       select ss.sid from shipment ss where ss.oid in (
       select oo.oid from [order] oo where oo.cid = 115753140 AND oo.Date_Placed = #1/2/2013#))
     )
     AND RR.pDate in (
       select zz.pDate from ship_is_filled_by zz where zz.SID in (
       select ss.sid from shipment ss where ss.oid in (
       select oo.oid from [order] oo where oo.cid = 115753140 AND oo.Date_Placed = #1/2/2013#))
     )
     AND RR.Instance in (
       select zz.Instance from ship_is_filled_by zz where zz.SID in (
       select ss.sid from shipment ss where ss.oid in (
       select oo.oid from [order] oo where oo.cid = 115753140 AND oo.Date_Placed = #1/2/2013#))
     )
    )
Query1 - Batch Contamination Analysis
       OR BB.Mixed_BID in (
       select distinct RR.mixed_BID2
       from Product_Record_Sellable RR
       where RR.PID in (
        select zz.PID from ship_is_filled_by zz where zz.SID in (
        select ss.sid from shipment ss where ss.oid in (
        select oo.oid from [order] oo where oo.cid = 115753140 AND oo.Date_Placed = #1/2/2013#))
       )
       AND RR.pDate in (
        select zz.pDate from ship_is_filled_by zz where zz.SID in (
        select ss.sid from shipment ss where ss.oid in (
        select oo.oid from [order] oo where oo.cid = 115753140 AND oo.Date_Placed = #1/2/2013#))
       )
       AND RR.Instance in (
        select zz.Instance from ship_is_filled_by zz where zz.SID in (
        select ss.sid from shipment ss where ss.oid in (
        select oo.oid from [order] oo where oo.cid = 115753140 AND oo.Date_Placed = #1/2/2013#))
       )
      )
     )
    )
   ) as a on a.Instance = z.Instance and a.PID = z.PID and a.pDate = z.pDate
  )
 )
);
Query1 - Batch Contamination Analysis
... And the final one that yields the result
select A.PERSONID, A.LNAME, A.FNAME, A.SHIPPING_ADDRESS1,
  (A.NUM/A.[NUMBER OF POSSIBLE CONTAMINATED])
  as PROBABILITY_CONTAMINATED
from (
  select count(P.SI_BID) as NUM, P.PERSONID,
    N.[NUMBER OF POSSIBLE CONTAMINATED], PP.LNAME, PP.FNAME,
    PP.SHIPPING_ADDRESS1
  from CONTAM_BATCH as C, POSSIBLE_CONTAM_BATCH as P,
    [QUERY_4_#_CONTAM] as N, PERSON as PP
  where C.SI_BID=P.SI_BID and PP.PERSONID=P.PERSONID
  group by P.PERSONID, N.[NUMBER OF POSSIBLE CONTAMINATED],
    PP.LNAME, PP.FNAME, PP.SHIPPING_ADDRESS1
) as A;
Query1 - Batch Contamination Analysis
 
|

|
Query2 - Profitability of Products
Purpose
As a small business, Project:Juice needs to know how profitable their products are. This query can help them determine which recipes to make for seasonal juices based on which fruits are the most profitable in which seasons. It can also help them make sampling events more cost effective by choosing to not sample their more expensive drinks.Query2 - Profitability of Products
SQL Implementation
Step 1: Find the cost of all single ingredient batches.
select SIB.SI_BID as SI_BID, ((SIB.Original_Weight*PRN.Cost) +
  E.Hourly_Wage*(EM.Time_Ended - EM.Time_Started)/60) as Cost
from EMPLOYEE as E, PRODUCT_RECORD_NONSELLABLE as PRN,
  SINGLE_INGREDIENT_BATCH as SIB, EMPLOYEE_MAKES_SIBATCH_WITH_EQUIP as EM
where PRN.PID = SIB.Ingredient_PID and
  EM.BID = SIB.SI_BID and
  EM.EID = E.EID;
Query2 - Profitability of Products
SQL Implementation
Step 2: Find the cost of all mixed ingredient batches.
select MB.Mixed_BID as Mix_BID,
  sum((BCB.Liquid_Volume/SIB.Produced_Volume)*CSB.Cost) as Cost
from MIXED_BATCH AS MB, MBATCH_CONTAINS_SIBATCH as BCB,
  costSingleBatch as CSB, SINGLE_INGREDIENT_BATCH as SIB
where MB.Mixed_BID = BCB.Mixed_BID
and BCB.SI_BID = CSB.SI_BID
group by MB.Mixed_BID;
Query2 - Profitability of Products
SQL Implementation
Step 3: Find the profit of each product instance, grouped by product.
select PRS.Pdate, PRS.PID,
    (PRS.Price-((B.Size/MBB.Final_Volume)*(MBC.Cost))) as Profit
from PRODUCT_RECORD_SELLABLE as PRS, BOTTLE as B, MIXED_BATCH as MBB,
    costMixBatch as MBC, Prod_Includes_Prod as PIP
where PRS.PID = PIP.Product and
    B.PID = PIP.Sub_Product and
    PRS.Mixed_BID1 = MBB.Mixed_BID and
    MBB.Mixed_BID = MBC.Mix_BID;
Query2 - Profitability of Products
SQL Implementation
Step 4: Total profit of each product.
select PP.PDate, PP.PID, sum(PP.Profit)
from ProductProfit as PP
group by PP.PID, PP.Pdate;
Query2 - Profitability of Products


Query3 - Sample Events Analysis
Purpose
Selection of information regarding each sampling event including event type and juices sampled to then run a marketing analysis using an ANOVA table to test for the correlation between these factors and the success of the event (customer yield).Query3 - Sample Events Analysis
SQL Implementation
Step 1: Generates which sampling events potential customers attended and which products they tasted
select j.pid, sum(IIf(pc1.contactID = c.cid and
                pc1.sampling_event = e1.eventID,1,0))
  as New_Customers, e1.eventID
from potential_customer as pc1, sampling_event as e1, customer as c, juices_at_event as j
where (((pc1.sampling_event)=e1.eventID) and ((pc1.contactID) = c.cid)
  and ((e1.eventID)=j.eventID))
group by j.pid, e1.eventID;
Query3 - Sample Events Analysis
SQL Implementation
Step 2: Determines customer yield depending on type and product sampled
select j.pid, Q3.New_Customers, Count(pc2.contactID) as Event_Attendees,
  [Q3.New_Customers]/[Event_Attendees] as customer_yield, e1.eventID,
  e1.type, e1.event_description
from potential_customer as pc2, sampling_event as e1, juices_at_event as j, query3 as Q3
where pc2.sampling_event = e1.eventID and e1.eventID=j.eventID
group by j.pid, e1.eventID, e1.type, Q3.New_Customers, e1.event_description;
Query3 - Sample Events Analysis

Query4 - Custom Cleanse Analysis
Purpose
We want to find out which juices are being chosen in custom cleanses over others in order to determine which juices are most desirable to our customers. This query will produce a list of juices most likely to be replaced and which juices they are being replaced with.Query4 - Custom Cleanse Analysis
SQL Implementation
select sum(iif(CD.Juice1 = 1003, CD.Quantity, 0))/sum(CD.Quantity) as DRG,
  sum(iif(CD.Juice1 = 1004, CD.Quantity, 0)) / sum(CD.Quantity) as DRGPlus, 4
  sum(iif(CD.Juice1 = 1005, CD.Quantity, 0)) / sum(CD.Quantity) as EZG,
  sum(iif(CD.Juice1 = 1006, CD.Quantity, 0)) / sum(CD.Quantity) as EZGPlus,
  sum(CD.Quantity) as n
from Cleanse_Details as CD
where exists (select *
from [Order] O
where O.OID = CD.OID and Date_Placed between #04/15/2013# and #04/21/2013#);
select (0.5*w3.drg*w3.n + 0.25*w2.drg*w2.n + 0.125*w1.drg*w1.n)/
  (0.5*w3.n + 0.25*w2.n + 0.125*w1.n) as drg,
    (0.5*w3.drgplus*w3.n + 0.25*w2.drgplus*w2.n + 0.125*w1.drgplus*w1.n)/
  (0.5*w3.n + 0.25*w2.n + 0.125*w1.n) as drgplus,
    (0.5*w3.ezg*w3.n + 0.25*w2.ezg*w2.n + 0.125*w1.ezg*w1.n)/
  (0.5*w3.n + 0.25*w2.n + 0.125*w1.n) as ezg,
    (0.5*w3.ezgplus*w3.n + 0.25*w2.ezgplus*w2.n + 0.125*w1.ezgplus*w1.n)/
  (0.5*w3.n + 0.25*w2.n + 0.125*w1.n) as ezgplus,
    (0.5*w3.n + 0.25*w2.n + 0.125*w1.n) as n
from week1trend as w1, week2trend as w2, week3trend as w3;
Query4 - Custom Cleanse Analysis

Query4 - Custom Cleanse Analysis
Forecasting Plot in Excel

Query5 - Yield Analysis
Purpose
Determine how much juice different blade (slice raw produce) and bag (strain juice) combinations generate.Query5 - Yield Analysis
SQL Implementation
select s.BagID, s.BladeID,
  avg(s.Produced_Volume/s.Original_Weight) as [Yield(Mean)],
  stdev(s.Produced_Volume/s.Original_Weight) as [Standard Dev],
  count(s.si_bid) as n
from single_ingredient_batch as s
where (s.ingredient_PID=3001) And s.Date_Made Between #1/1/2012# and #12/30/2012#
group by s.BagID, s.BladeID
order by Avg(s.Produced_Volume/s.Original_Weight) desc;
Query5 - Yield Analysis

Normalization Analysis
Partial Dependence
Cleanse(PID12, Cleanse_Name, Number_of_Days, Price)
- CleansePrice(PID12, Number_of_Days, Price)
- CleanseName(PID12, Cleanse_Name)
Transitive Dependence
Customer(CID1, Customer_Type, Group_Name, Bdate, Gender, Company, County, Tax_Rate, Notes)
- Customer(CID1, Customer_Type, Group_Name, Bdate, Gender, Company, County, Notes)
- County(County, Tax_Rate)
Aaaand... that's the end
Questions? Comments?
/